

';
?>
';
?>
We feel devotion
DataCenter
EUROLEAGUE ANALYSIS
Euroleague Lineups Stats
BasketStories presents the Euroleague teams’ and players’ statistics per lineup through the BasketStories DataCenter.
Published: 25/10/2025 17:17
Through the BasketStories DataCenter, every Euroleague fan has access to a wide range of valuable data about the competition, its teams, and its players — with a clear focus, of course, on Euroleague Fantasy, our favorite habit all these years. Many of these stats are insights that arise from the combination of multiple data points to reach the required level of understanding within a defined analytical framework (e.g., opponent stats by position).
Now, we take things a step further and introduce two new pages-tools that create their own framework for exploring and analyzing statistical information, both at an individual and team level, based on all the action that takes place during games, using the data included in the official play-by-plays.
These are the Euroleague team lineups statistics and the Euroleague player per lineup statistics.
This information is made available interactively to every fan of the competition, so that each can seek knowledge within their own desired context. These pages can serve as a useful and valuable tool for anyone spending time studying Euroleague and Euroleague Fantasy — from casual fans to professional analysts.
Of course, since play-by-play data are not 100% accurate regarding the exact timing of certain events, some small discrepancies may appear in very specific cases. However, these are only at a detail level and do not affect the overall picture of players, teams, or the lineups involved.
It should also be emphasized that, unlike other approaches, we count the free throws executed by a player after a substitution occurring at the exact same time as the foul itself within the first lineup (the one active when the foul was made), and not in the lineup formed after the substitution (when the free throws are actually taken).
Let’s take a detailed look at what these two new BasketStories DataCenter pages offer, with the help of concrete examples.
On this page, we present the statistics of Euroleague lineups and their differential performance across statistical categories compared to their on-court opponents during the same time periods. Essentially, we examine how a team performs overall when specific players are on the court together, with the final numbers reflecting its strengths and weaknesses against all opponents.
This information covers every possible teammate combination for each team and shows what happens on the floor precisely during the intervals when those specific players share it. Is that big-man duo effective? With which guard on the floor does the this duo perform better? Do small-ball lineups work? Is the improved ball movement worth the rebounding drop-off? Which duos or trios of players fit best together? These are the kinds of questions that can be answered through this newly available data.
All Euroleague lineup stats are already available through the corresponding tool in the BasketStories DataCenter.
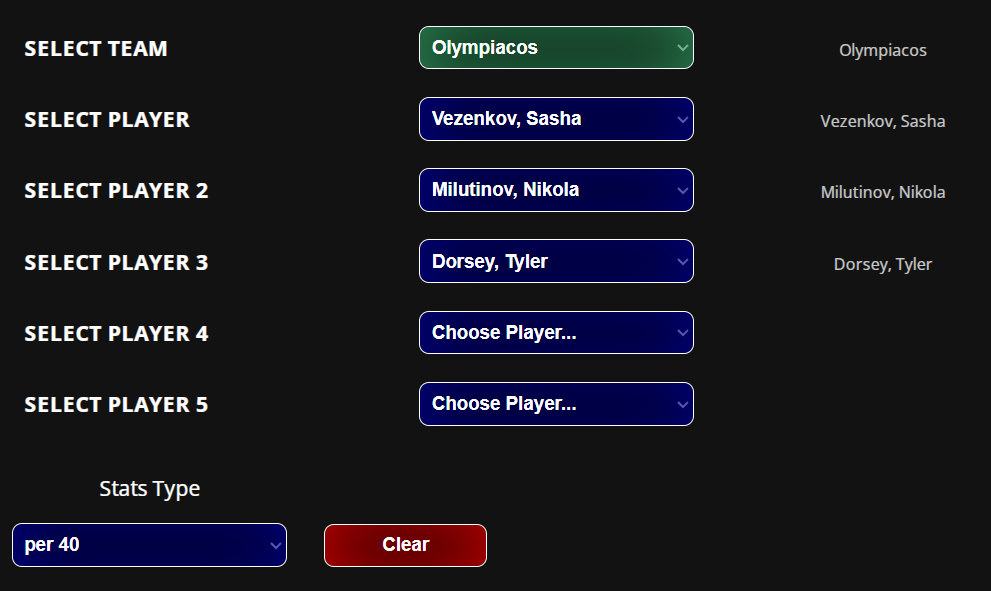
By first selecting a team, you can choose from 1 to 5 players (fields PLAYER 1–PLAYER 5) to see how the team’s and its opponents’ statistics evolve during the time those players share the court. Below the team and opponent stats, the respective differentials are displayed, showing whether the final balance is positive or negative.
Along with the team’s overall statistics for that lineup, the page displays in separate tables all lineup combinations that include your selected players — along with their corresponding team, opponent, and differential stats. So, if you’ve selected three players, all possible lineups including them are presented. Their individual stats essentially compose the aggregated stats of the main lineup displayed. You can also switch between total and per40 stats for both the main lineup and its sub-combinations.
Let’s look at a few concrete examples to better understand the level of detail this data provides.
We start with Olympiacos and how the Greek team performs — relative to its opponents — when its stars are on the court. The tip of the spear is clearly Vezenkov, who leads the team in many statistical categories, while Milutinov remains a key component — especially this season, with Fall sidelined and Hall still adjusting — serving as a central pillar of the Reds’ game.
Beginning with the Serbian center, we immediately see his on-court impact. In 112:58 minutes, Milutinov’s Olympiacos outscored opponents 265–238, dominated the boards (125–84), and won the foul battle (71–44), producing an impressive Index Rating differential of 331–230. Per 40 minutes, those translate to +9.5 points, +14.6 rebounds, +9 fouls, and +35.8 in ranking.
We’ll build our example on Milutinov and add Vezenkov as Player 2. The two share 95:27 on the floor — essentially most of Milutinov’s minutes — and their per40 averages show a clear impact: with this main frontcourt duo, Olympiacos outscores opponents by 14.7 points (96.8–82.1), grabs 16.8 more rebounds (46.1–29.3), draws 9.5 more fouls, and posts a +46.5 Index Rating differential (122.4–75.9). Their impact is more than evident.
Continuing in the same pattern, we add Dorsey as Player 3, creating the stats for the Milutinov–Vezenkov–Dorsey trio (86:10 total minutes). The per40 numbers skyrocket: +20.9 points, +19.5 rebounds, +57.6 in ranking! Almost scary.
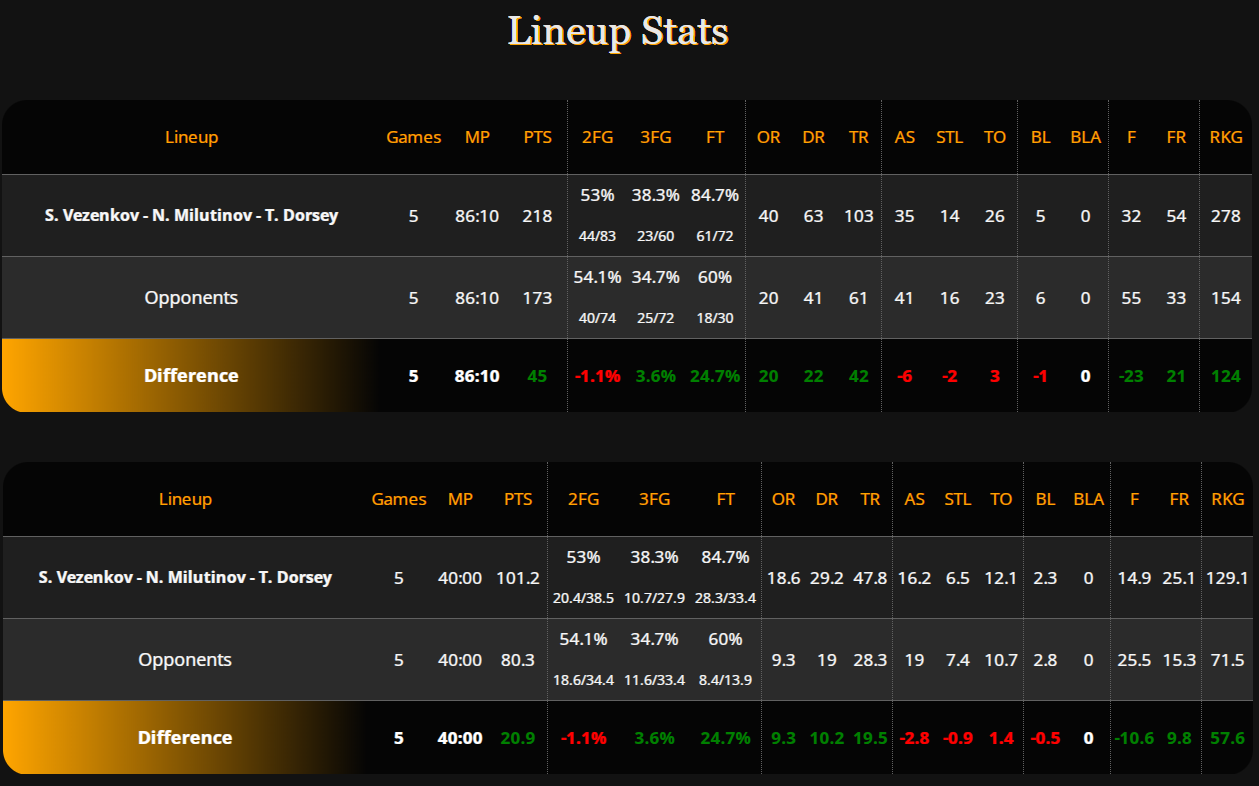
While scoring and ranking differences are easily explained by Dorsey’s shooting ability, how do we interpret the rebound gap? One explanation might be that rebounding dominance weakens slightly later in games, when Dorsey is off the court (since he’s usually the last starter to sit). Without him, the average drops, as early minutes bring even stronger dominance. We haven’t verified this — nor is that the purpose here — but it’s an example of how one might think about interpreting the data now available.
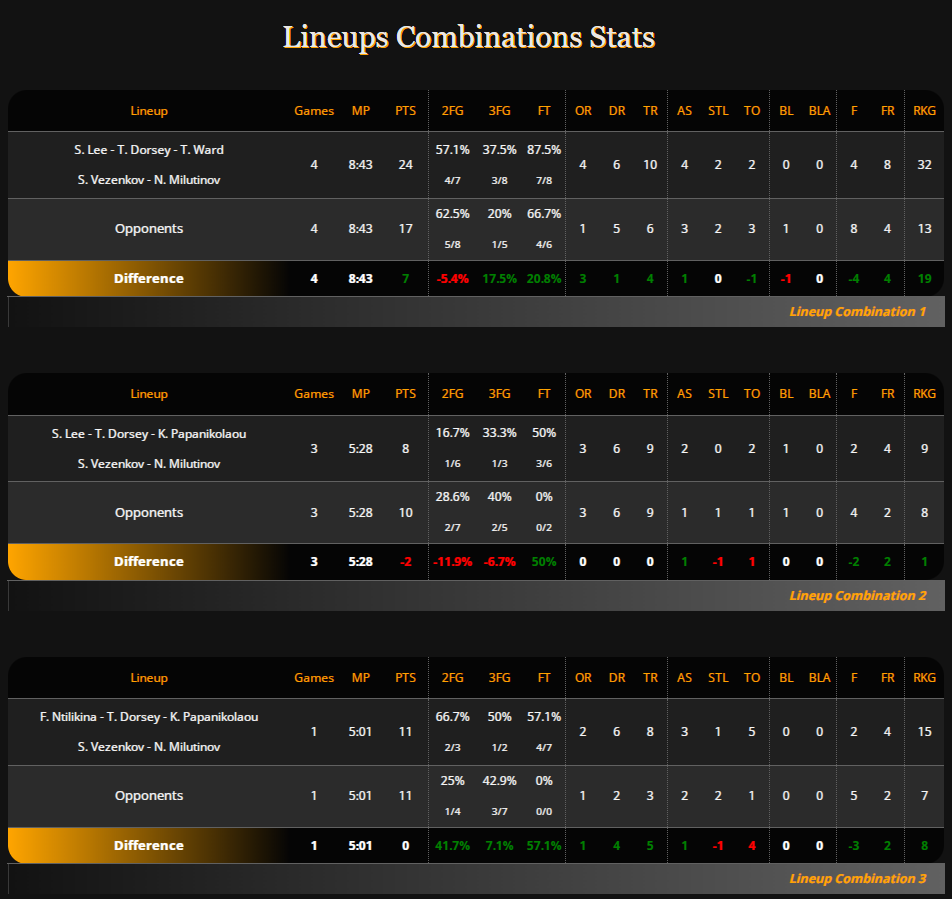
You can, of course, explore further combinations by selecting additional players in the Player 4 and Player 5 fields. Moreover, for any lineup you create, the tool lists below all the sub-lineups it includes, with full team, opponent, and differential stats. For instance, the Milutinov–Vezenkov–Dorsey trio appears in seven sub-lineups, whose stats together form the overall numbers of that trio.
You can then go deeper by adding Player 4 or Player 5 to see the corresponding lineup and its sub-lineups displayed below. The next image shows three of the seven combinations for the trio we just analyzed.
With all this data at your disposal, you can become the coach identifying each team’s most effective combinations. How do players’ coexistence patterns affect team play? Which combinations work best? Is a player’s presence always beneficial, or does the team perform better with different mixes on the floor? In which aspects does each lineup excel or fall short? All this knowledge is now at your fingertips — with the freedom to explore it through your own filters and methods.
Different lineups, their players, and related stats provide a representative picture of each team’s strengths and weaknesses and how it performs under different combinations. The previous tool focuses on team performance through various player groupings on the floor. Here, we can look from a different angle — analyzing how an individual player performs depending on which teammates he shares the floor with.
We now move from the team level to the player level, presenting Euroleague player statistics per lineup and their differences across statistical categories compared to each player’s season averages.
This allows us to examine how a player’s numbers change when he’s part of a lineup with specific teammates, identifying who benefits or limits him most. Naturally, this brings us closer to the Fantasy side — where ideal combinations can reveal potential opportunities due to rotation changes — but also to pure basketball insight: which teammate, by position for instance, best complements a player’s performance? Does he play better with the starter or backup center? With two playmakers or just one? These are the kinds of questions this tool helps answer.
All Euroleague player-per-lineup statistics are already available through the corresponding tool in the BasketStories DataCenter.
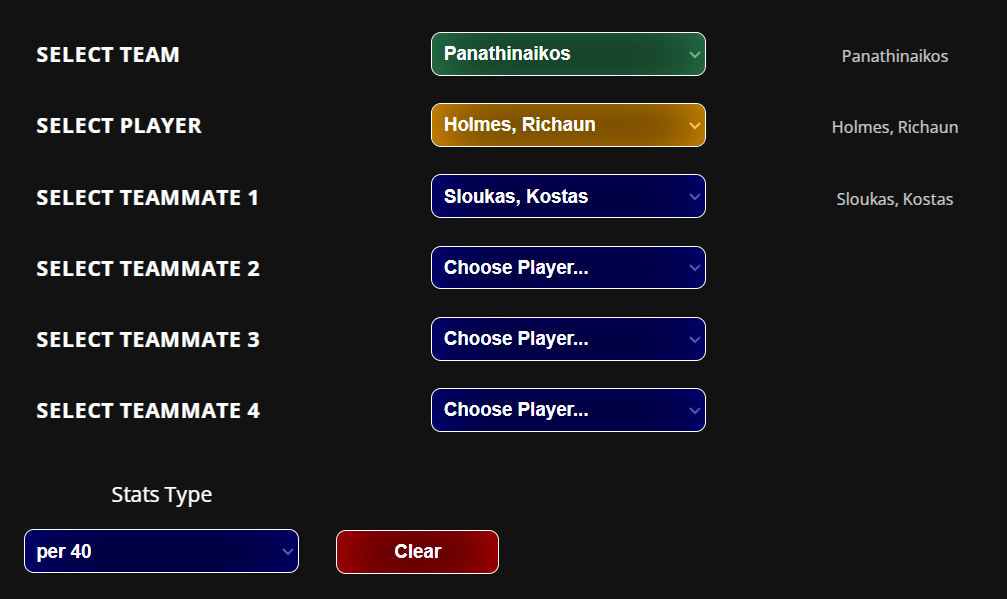
By first selecting a team, you can pick one player (field PLAYER) and then up to four teammates (fields TEAMMATE 1–4) to see how his numbers change based on their presence. The tool shows only the player’s stats for the periods when he shares the court with those selected teammates — whether one or all four. Alongside these numbers, his season averages are displayed as a reference (to compare directly for how much those teammates influence his performance). You can also switch between per40 or total stats.
Let’s look at specific examples to see how this new BasketStories DataCenter tool can be used.
Let’s turn to Panathinaikos to see which guard best utilizes the team’s new addition, Richaun Holmes — or, more precisely, with which guard the former NBAer performs best so far.
First, we select Holmes as Player 1. We initially see only his averages, shown in per40 for easier comparison: 21 points on 73.1% twos and a 24.4 Index Rating per 40 minutes in his first five Euroleague games.
Next, we can check his output alongside each guard individually by selecting them in the Teammate 1 field.
With Nunn, his per40 numbers are slightly lower — 19 points, 68.8% twos, 23 Index Rating.
With Shorts, the drop is a bit greater — 17.9 points, 71.4% twos, 19.1 Index Rating — and even more so with Grant.
The picture changes dramatically when Sloukas is on the floor (in four games): 21 points become 31, two-point accuracy rises to 91.7%, and his Index Rating jumps from 24.4 to 34.9 per40.
This clearly shows that Holmes performs best when Sloukas shares the court with him. However, we can’t dismiss the contribution of the other guards so easily.
With Nunn, Holmes’s overall averages are slightly lower, yet if we add Nunn as Teammate 2 — together with Sloukas — we find that his production improves further: 40.7 points, 100% two-point shooting (!), and 40.7 Index Rating per40. The sample size here is smaller (just 7:52 minutes) and may not be enough for solid conclusions, but it’s certainly an interesting indication of Panathinaikos’ internal balance — and an example of how lineup combinations can reveal the contributions of different teammates to one another’s performance. The three Holmes tables with Sloukas, Nunn, and Sloukas–Nunn appear in the image below.

Larkin with Smits
Now let’s go to Efes, where Osmani will remain out for another two weeks — meaning Smits is expected to take over as starting power forward. How does Larkin perform when sharing the floor with the Latvian?
The two have played 58:02 together over the first five Euroleague games, with Larkin collecting about half (34/70) of his total Index Rating during those minutes, despite playing 159:31 overall. Clearly, his performance, in Index Rating terms, is higher with Smits next to him: 23.4 per40 versus his overall average of 17.6. We can also note improved rebounds, assists, and turnovers in that span, while his shot volume stays nearly the same — though his two-point accuracy rises and three-point percentage dips.
H. Diallo and Luwawu-Cabarrot with Nowell
Let’s finish with a last example in Baskonia, where Trent Forrest — the team’s floor general — is currently injured. How do players perform when Markquis Nowell, his direct replacement, is on the court?
Consider Hamidou Diallo, who has started the season in explosive fashion. He has shared 52:25 with Nowell (out of his total 120:40), and his per40 numbers remain largely stable — except for one notable area: drawn fouls, which rise from 7.3 to 12.2 with Nowell on the court. In absolute terms, 16 of Diallo’s 22 drawn fouls have come while paired with the American guard.
Likewise, when examining Luwawu-Cabarrot, we see a more active performance next to Nowell, with his per40 Index Rating rising to 29.1 versus his 23.6 overall average. In total, 56 of his 84 Index points were recorded during minutes shared with Nowell, indicating stronger output in those stretches.
All these insights are data that each user can interpret and utilize in their own way. Sometimes the conclusions are straightforward from the numbers themselves; other times, not as much. The new BasketStories tools let you dive deeper, exploring every possible lineup combination to uncover the knowledge you seek.
Devotion.
Now, we take things a step further and introduce two new pages-tools that create their own framework for exploring and analyzing statistical information, both at an individual and team level, based on all the action that takes place during games, using the data included in the official play-by-plays.
These are the Euroleague team lineups statistics and the Euroleague player per lineup statistics.
This information is made available interactively to every fan of the competition, so that each can seek knowledge within their own desired context. These pages can serve as a useful and valuable tool for anyone spending time studying Euroleague and Euroleague Fantasy — from casual fans to professional analysts.
Of course, since play-by-play data are not 100% accurate regarding the exact timing of certain events, some small discrepancies may appear in very specific cases. However, these are only at a detail level and do not affect the overall picture of players, teams, or the lineups involved.
It should also be emphasized that, unlike other approaches, we count the free throws executed by a player after a substitution occurring at the exact same time as the foul itself within the first lineup (the one active when the foul was made), and not in the lineup formed after the substitution (when the free throws are actually taken).
Let’s take a detailed look at what these two new BasketStories DataCenter pages offer, with the help of concrete examples.
Euroleague Lineups Statistics
On this page, we present the statistics of Euroleague lineups and their differential performance across statistical categories compared to their on-court opponents during the same time periods. Essentially, we examine how a team performs overall when specific players are on the court together, with the final numbers reflecting its strengths and weaknesses against all opponents.
This information covers every possible teammate combination for each team and shows what happens on the floor precisely during the intervals when those specific players share it. Is that big-man duo effective? With which guard on the floor does the this duo perform better? Do small-ball lineups work? Is the improved ball movement worth the rebounding drop-off? Which duos or trios of players fit best together? These are the kinds of questions that can be answered through this newly available data.
All Euroleague lineup stats are already available through the corresponding tool in the BasketStories DataCenter.
By first selecting a team, you can choose from 1 to 5 players (fields PLAYER 1–PLAYER 5) to see how the team’s and its opponents’ statistics evolve during the time those players share the court. Below the team and opponent stats, the respective differentials are displayed, showing whether the final balance is positive or negative.
Along with the team’s overall statistics for that lineup, the page displays in separate tables all lineup combinations that include your selected players — along with their corresponding team, opponent, and differential stats. So, if you’ve selected three players, all possible lineups including them are presented. Their individual stats essentially compose the aggregated stats of the main lineup displayed. You can also switch between total and per40 stats for both the main lineup and its sub-combinations.
Let’s look at a few concrete examples to better understand the level of detail this data provides.
Examples
We start with Olympiacos and how the Greek team performs — relative to its opponents — when its stars are on the court. The tip of the spear is clearly Vezenkov, who leads the team in many statistical categories, while Milutinov remains a key component — especially this season, with Fall sidelined and Hall still adjusting — serving as a central pillar of the Reds’ game.
Beginning with the Serbian center, we immediately see his on-court impact. In 112:58 minutes, Milutinov’s Olympiacos outscored opponents 265–238, dominated the boards (125–84), and won the foul battle (71–44), producing an impressive Index Rating differential of 331–230. Per 40 minutes, those translate to +9.5 points, +14.6 rebounds, +9 fouls, and +35.8 in ranking.
We’ll build our example on Milutinov and add Vezenkov as Player 2. The two share 95:27 on the floor — essentially most of Milutinov’s minutes — and their per40 averages show a clear impact: with this main frontcourt duo, Olympiacos outscores opponents by 14.7 points (96.8–82.1), grabs 16.8 more rebounds (46.1–29.3), draws 9.5 more fouls, and posts a +46.5 Index Rating differential (122.4–75.9). Their impact is more than evident.
Continuing in the same pattern, we add Dorsey as Player 3, creating the stats for the Milutinov–Vezenkov–Dorsey trio (86:10 total minutes). The per40 numbers skyrocket: +20.9 points, +19.5 rebounds, +57.6 in ranking! Almost scary.
While scoring and ranking differences are easily explained by Dorsey’s shooting ability, how do we interpret the rebound gap? One explanation might be that rebounding dominance weakens slightly later in games, when Dorsey is off the court (since he’s usually the last starter to sit). Without him, the average drops, as early minutes bring even stronger dominance. We haven’t verified this — nor is that the purpose here — but it’s an example of how one might think about interpreting the data now available.
You can, of course, explore further combinations by selecting additional players in the Player 4 and Player 5 fields. Moreover, for any lineup you create, the tool lists below all the sub-lineups it includes, with full team, opponent, and differential stats. For instance, the Milutinov–Vezenkov–Dorsey trio appears in seven sub-lineups, whose stats together form the overall numbers of that trio.
You can then go deeper by adding Player 4 or Player 5 to see the corresponding lineup and its sub-lineups displayed below. The next image shows three of the seven combinations for the trio we just analyzed.
With all this data at your disposal, you can become the coach identifying each team’s most effective combinations. How do players’ coexistence patterns affect team play? Which combinations work best? Is a player’s presence always beneficial, or does the team perform better with different mixes on the floor? In which aspects does each lineup excel or fall short? All this knowledge is now at your fingertips — with the freedom to explore it through your own filters and methods.
Euroleague Player per Lineup Statistics
Different lineups, their players, and related stats provide a representative picture of each team’s strengths and weaknesses and how it performs under different combinations. The previous tool focuses on team performance through various player groupings on the floor. Here, we can look from a different angle — analyzing how an individual player performs depending on which teammates he shares the floor with.
We now move from the team level to the player level, presenting Euroleague player statistics per lineup and their differences across statistical categories compared to each player’s season averages.
This allows us to examine how a player’s numbers change when he’s part of a lineup with specific teammates, identifying who benefits or limits him most. Naturally, this brings us closer to the Fantasy side — where ideal combinations can reveal potential opportunities due to rotation changes — but also to pure basketball insight: which teammate, by position for instance, best complements a player’s performance? Does he play better with the starter or backup center? With two playmakers or just one? These are the kinds of questions this tool helps answer.
All Euroleague player-per-lineup statistics are already available through the corresponding tool in the BasketStories DataCenter.
By first selecting a team, you can pick one player (field PLAYER) and then up to four teammates (fields TEAMMATE 1–4) to see how his numbers change based on their presence. The tool shows only the player’s stats for the periods when he shares the court with those selected teammates — whether one or all four. Alongside these numbers, his season averages are displayed as a reference (to compare directly for how much those teammates influence his performance). You can also switch between per40 or total stats.
Let’s look at specific examples to see how this new BasketStories DataCenter tool can be used.
Examples
Let’s turn to Panathinaikos to see which guard best utilizes the team’s new addition, Richaun Holmes — or, more precisely, with which guard the former NBAer performs best so far.
First, we select Holmes as Player 1. We initially see only his averages, shown in per40 for easier comparison: 21 points on 73.1% twos and a 24.4 Index Rating per 40 minutes in his first five Euroleague games.
Next, we can check his output alongside each guard individually by selecting them in the Teammate 1 field.
With Nunn, his per40 numbers are slightly lower — 19 points, 68.8% twos, 23 Index Rating.
With Shorts, the drop is a bit greater — 17.9 points, 71.4% twos, 19.1 Index Rating — and even more so with Grant.
The picture changes dramatically when Sloukas is on the floor (in four games): 21 points become 31, two-point accuracy rises to 91.7%, and his Index Rating jumps from 24.4 to 34.9 per40.
This clearly shows that Holmes performs best when Sloukas shares the court with him. However, we can’t dismiss the contribution of the other guards so easily.
With Nunn, Holmes’s overall averages are slightly lower, yet if we add Nunn as Teammate 2 — together with Sloukas — we find that his production improves further: 40.7 points, 100% two-point shooting (!), and 40.7 Index Rating per40. The sample size here is smaller (just 7:52 minutes) and may not be enough for solid conclusions, but it’s certainly an interesting indication of Panathinaikos’ internal balance — and an example of how lineup combinations can reveal the contributions of different teammates to one another’s performance. The three Holmes tables with Sloukas, Nunn, and Sloukas–Nunn appear in the image below.
Larkin with Smits
Now let’s go to Efes, where Osmani will remain out for another two weeks — meaning Smits is expected to take over as starting power forward. How does Larkin perform when sharing the floor with the Latvian?
The two have played 58:02 together over the first five Euroleague games, with Larkin collecting about half (34/70) of his total Index Rating during those minutes, despite playing 159:31 overall. Clearly, his performance, in Index Rating terms, is higher with Smits next to him: 23.4 per40 versus his overall average of 17.6. We can also note improved rebounds, assists, and turnovers in that span, while his shot volume stays nearly the same — though his two-point accuracy rises and three-point percentage dips.
H. Diallo and Luwawu-Cabarrot with Nowell
Let’s finish with a last example in Baskonia, where Trent Forrest — the team’s floor general — is currently injured. How do players perform when Markquis Nowell, his direct replacement, is on the court?
Consider Hamidou Diallo, who has started the season in explosive fashion. He has shared 52:25 with Nowell (out of his total 120:40), and his per40 numbers remain largely stable — except for one notable area: drawn fouls, which rise from 7.3 to 12.2 with Nowell on the court. In absolute terms, 16 of Diallo’s 22 drawn fouls have come while paired with the American guard.
Likewise, when examining Luwawu-Cabarrot, we see a more active performance next to Nowell, with his per40 Index Rating rising to 29.1 versus his 23.6 overall average. In total, 56 of his 84 Index points were recorded during minutes shared with Nowell, indicating stronger output in those stretches.
All these insights are data that each user can interpret and utilize in their own way. Sometimes the conclusions are straightforward from the numbers themselves; other times, not as much. The new BasketStories tools let you dive deeper, exploring every possible lineup combination to uncover the knowledge you seek.
Devotion.


